Tech Tip: Displaying the cache details in the runtime explorer
PRODUCT: 4D | VERSION: 2004.4 | PLATFORM: Mac & Win
Published On: August 25, 2006
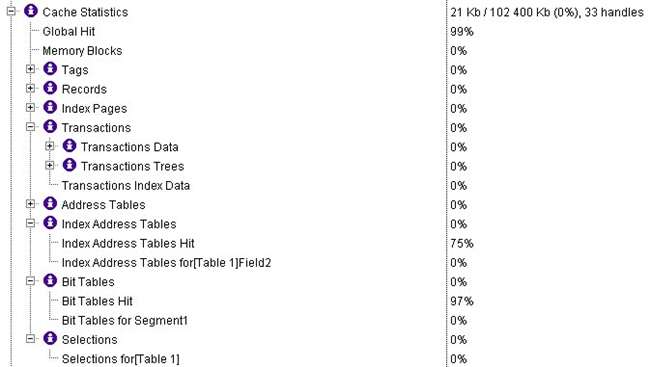
In the runtime explorer, you can display the details of the 4D cache. This allows you to have access to detailed cache data for tables/index and transactions. This allows you to have a direct insight on how how the cache operates:

To display the detailed monitoring:
1- Open the runtime explorer
2- In the watch pane, right-click on the page (Control + click on Mac OS) and select 'Enable activity monitoring'.
3- If the Cache statistics item was opened, collapse and expand it to refresh its contents.
The runtime explorer now displays the cache details.
