
Tech Tip: 4D 6.5 method editor break points
PRODUCT: 4D | VERSION: 6.5 | PLATFORM: Mac & Win
Published On: March 18, 1999
Under 4th Dimension 6.5, you can for the first time create break points in the method editor. To do this, just click near the left edge of the window next to a line where you want to start the debugger (inside a dotted line you will see at the left edge of the code editor window). This will place a red dot next to the line, and will start the debugger when execution gets to that line. No more Trace commands!
We are all familiar with putting a Trace command in our code, and then having to click on the Run button a number of times, to get to the situation we are actually having trouble with. In such a case, it is often very useful to use conditional break points. To do this, hold down the Alt key (Windows) or the Option key (Macintosh) when you click to set the break point. You will see a dialog into which you can enter an expression:
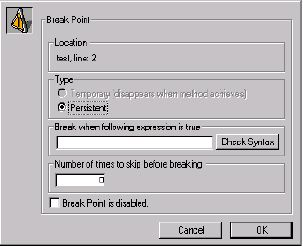
If you enter an expression here, 4D's debugger will only activate if the expression evaluates to True. This can make the debugger much more useful. For instance:
Some of the new 6.5 commands are particularly useful here. Good examples are (Is New Record) or (Is Record Loaded).
There are countless other possibilities, so every time you are about to set a break point, ask yourself if a conditional break point won't be a quicker way to debugging the situation that's troubling you.
We are all familiar with putting a Trace command in our code, and then having to click on the Run button a number of times, to get to the situation we are actually having trouble with. In such a case, it is often very useful to use conditional break points. To do this, hold down the Alt key (Windows) or the Option key (Macintosh) when you click to set the break point. You will see a dialog into which you can enter an expression:
If you enter an expression here, 4D's debugger will only activate if the expression evaluates to True. This can make the debugger much more useful. For instance:
- You can enter Shift Down or Caps Lock Down to give you the ability to activate the debugger when you choose by pressing a key;
- You can enter (form event=on printing detail) if your problem is only during printing;
- You can test the value of a variable;
- You can enter (Printing Page=2) if you are having a problem on the second page of a report; and
Some of the new 6.5 commands are particularly useful here. Good examples are (Is New Record) or (Is Record Loaded).
There are countless other possibilities, so every time you are about to set a break point, ask yourself if a conditional break point won't be a quicker way to debugging the situation that's troubling you.