Tech Tip: How to determine which form is in use
PRODUCT: 4D | VERSION: 2004 | PLATFORM: Mac & Win
Published On: June 20, 2007
To determine which form is being used in a given process the debug/trace window can be used.
To do so, you just need to select the current process from the list that is displayed when pressing Alt + Shift + right mouse click on Windows or Control + Option + Command + click on Mac OS. Once selected, the next action in that process will open the debug window.
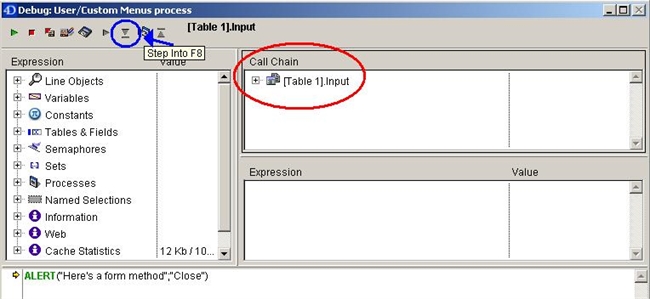
By doing this immediately before opening the form you can usually be sure that the form method will be called when it opens. Using the step into function of the debugger you should be able to find the name of the form by looking in the Call Chain window and watching for the form method to come up. Here is a screen shot of the form method in the Call Chain window with that and the step into button highlighted:

You can also double-click any method in the call chain to view its contents and, by doing so, locate the line of code that opened the form (e.g. DIALOG, MODIFY SELECTION, etc.).
To do so, you just need to select the current process from the list that is displayed when pressing Alt + Shift + right mouse click on Windows or Control + Option + Command + click on Mac OS. Once selected, the next action in that process will open the debug window.
By doing this immediately before opening the form you can usually be sure that the form method will be called when it opens. Using the step into function of the debugger you should be able to find the name of the form by looking in the Call Chain window and watching for the form method to come up. Here is a screen shot of the form method in the Call Chain window with that and the step into button highlighted:

You can also double-click any method in the call chain to view its contents and, by doing so, locate the line of code that opened the form (e.g. DIALOG, MODIFY SELECTION, etc.).
