
Tech Tip: Debugging ODBC applications - use Tracing
PRODUCT: 4D | VERSION: 2004 | PLATFORM: Win
Published On: July 6, 2007
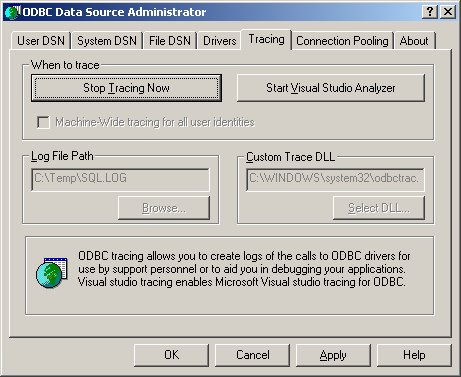
The ODBC Data Source Administrator in Windows has a feature called "Tracing", which allows for the logging of all ODBC calls to text file. Here is a screenshot of the dialog:
This log file will include each and every call made into the ODBC driver, with parameter values (including constants) as well as return codes. Here is an example of a call to the SQLSetStmtAttr function:
This log can prove quite useful when debugging ODBC applications. To enable the log:
Be sure to make note of the location of the log file. Also note that the log file can grow quite large so it is a good idea to delete it from time to time.
This log file will include each and every call made into the ODBC driver, with parameter values (including constants) as well as return codes. Here is an example of a call to the SQLSetStmtAttr function:
| 4D 9a4-9a8 ENTER SQLSetStmtAttr SQLHSTMT 01112000 SQLINTEGER 27 <SQL_ATTR_ROW_ARRAY_SIZE> SQLPOINTER 0x00000001 SQLINTEGER 0 |
This log can prove quite useful when debugging ODBC applications. To enable the log:
- Launch the ODBC Data Source Administrator.
- Click on the "Tracing" tab.
- Click the button labeled "Start Tracing Now".
Be sure to make note of the location of the log file. Also note that the log file can grow quite large so it is a good idea to delete it from time to time.