
Tech Tip: Viewing breakpoints in the Runtime Explorer
PRODUCT: 4D | VERSION: 14.3 | PLATFORM: Mac & Win
Published On: April 20, 2015
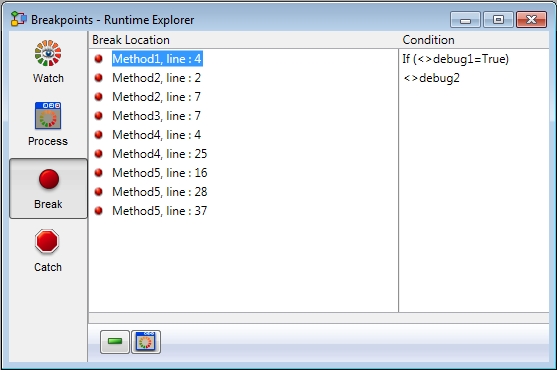
A quick way to view all the breakpoints set in the database is to view them in the runtime explorer: Run->Runtime Explorer->Break.
The explorer will display a list of all the breakpoints. The list will display the method name and line number the breakpoint is located at.
Viewing the breakpoint:
Double clicking on one of the list items will open the method editor of the corresponding method, and highlight the line.
Removing breakpoints:
There are two buttons available in the explorer below:
 is used for removing the selected breakpoint.
 is used to remove all breakpoints in the database.
Adding conditions:
The explorer also allows conditions to be set for each breakpoint. To add a condition, click on the Condition column. Each condition can contain a 4D formula (expression, command, or project method). Conditions are most useful most useful when the 4D formula returns a boolean value. If the condition is fufilled, the breakpoint will be enabled. If the condition is not fufilled, the breakpoint will not be enabled.
Conditions allow the user to programatically determine when to trigger a breakpoint when debugging their code, and when to prevent the breakpoint from triggering, without actually having to remove the breakpoint.
The explorer will display a list of all the breakpoints. The list will display the method name and line number the breakpoint is located at.
Viewing the breakpoint:
Double clicking on one of the list items will open the method editor of the corresponding method, and highlight the line.
Removing breakpoints:
There are two buttons available in the explorer below:
is used for removing the selected breakpoint. is used to remove all breakpoints in the database.Adding conditions:
The explorer also allows conditions to be set for each breakpoint. To add a condition, click on the Condition column. Each condition can contain a 4D formula (expression, command, or project method). Conditions are most useful most useful when the 4D formula returns a boolean value. If the condition is fufilled, the breakpoint will be enabled. If the condition is not fufilled, the breakpoint will not be enabled.
Conditions allow the user to programatically determine when to trigger a breakpoint when debugging their code, and when to prevent the breakpoint from triggering, without actually having to remove the breakpoint.