
Tech Tip: How to format y axis of the SVG generated using GRAPH
PRODUCT: 4D | VERSION: 15.x | PLATFORM: Mac & Win
Published On: May 19, 2017
The GRAPH command allows users to quickly build svg graphs. The command has many settings that can be set, but one not included is the ability to format the y axis. In order to modify the y axis values, the svg can be manipulated using the SVG component, and/or 4D's DOM commands. Below is an utility method that adds a pattern the the front of the y axis.
Example:
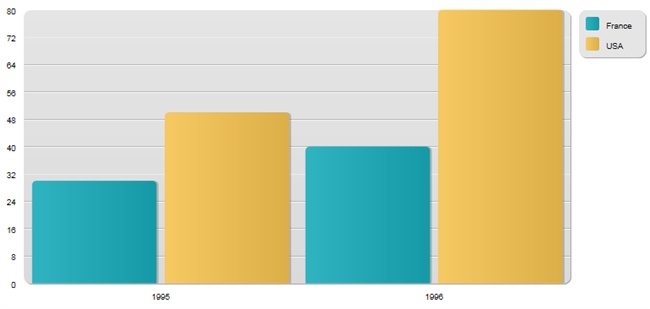
The code generates the graph:
To add a '$; sign to the front of the y axis labels, run GRAPH_PREPEND_TO_Y_AXIS:
The resulting graph looks like the following:
| // Method: GRAPH_PREPEND_TO_Y_AXIS // $1 - Source grahp // $2 - pattern to prepend // $0 - Modified graph C_PICTURE($1;$input_picture) C_TEXT($2;$pattern) C_PICTURE($0) If (Count parameters>1) $input_picture:=$1 $pattern:=$2 $svg_ref:=SVG_Open_picture ($input_picture) If (SVG_Is_reference_valid ($svg_ref)) $xml_ref:=DOM Find XML element by ID($svg_ref;"ID_y_value") If (SVG_Is_reference_valid ($xml_ref)) DOM GET XML CHILD NODES($xml_ref;$nodes;$nodeRefs) For ($i;1;Size of array($nodes)) $y_ref:=$nodeRefs{$i} If (SVG_Is_reference_valid ($y_ref)) DOM GET XML ELEMENT VALUE($y_ref;$y_val) DOM SET XML ELEMENT VALUE($y_ref;$pattern+$y_val) End if End for SVG EXPORT TO PICTURE($svg_ref;$0;Copy XML data source) End if End if End if |
Example:
The code generates the graph:
| C_PICTURE(vGraph) //Variable of graph ARRAY TEXT(X;2) //Create an array for the x-axis X{1}:="1995" //X Label #1 X{2}:="1996" //X Label #2 ARRAY REAL(A;2) //Create an array for the y-axis A{1}:=30 //Insert some data A{2}:=40 ARRAY REAL(B;2) //Create an array for the y-axis B{1}:=50 //Insert some data B{2}:=80 vType:=1 //Initialize graph type GRAPH(vGraph;vType;X;A;B) //Draw the graph GRAPH SETTINGS(vGraph;0;0;0;0;False;False;True;"France";"USA") //Set the legends for the graph |
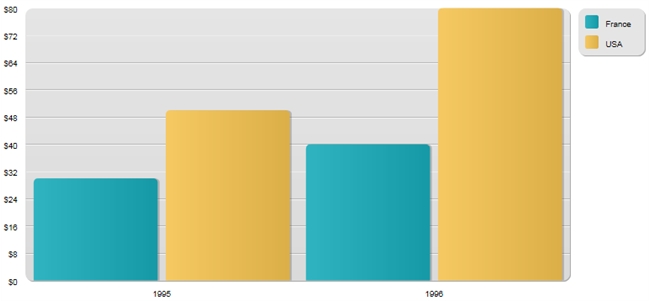
To add a '$; sign to the front of the y axis labels, run GRAPH_PREPEND_TO_Y_AXIS:
| vGraph:=GRAPH_PREPEND_TO_Y_AXIS(vGraph;'$') |
The resulting graph looks like the following: