
Tech Tip: Additional Expressions in Custom Expression Pane
PRODUCT: 4D | VERSION: 17 | PLATFORM: Mac & Win
Published On: June 27, 2019
When testing new code or trying to debug an issue 4D's debugger is very helpful. The debugger has two expression panes, one on the left and one to the lower right. The one on the left contains a preset hierarchical list of expressions related to the process while the second expression pane allows custom expressions to be added to it to check the values of specific items.
The first expression pane contains groups of values related to the process that can help cut down on time when trying to debug a method. The second expression pane is typically used more frequently due to the customization of expressions desired and as such is typically expanded to better display the values and the list. A trick to make use of both features is to drag and drop a group from the first expression pane to the second expression pane.
For example, local variables are listed in the first expression pane under Variables > Local. The Local expression can be dragged and dropped into the second expression pane and saved as shown below.
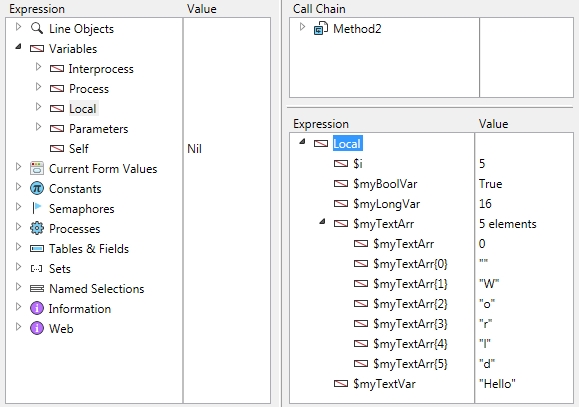
Now when running the debugger on any method the Local expression can be expanded to view all local variables created up to the break point without needing to manually add them in for a specific method and clearing them out when looking at another method.
The first expression pane contains groups of values related to the process that can help cut down on time when trying to debug a method. The second expression pane is typically used more frequently due to the customization of expressions desired and as such is typically expanded to better display the values and the list. A trick to make use of both features is to drag and drop a group from the first expression pane to the second expression pane.
For example, local variables are listed in the first expression pane under Variables > Local. The Local expression can be dragged and dropped into the second expression pane and saved as shown below.
Now when running the debugger on any method the Local expression can be expanded to view all local variables created up to the break point without needing to manually add them in for a specific method and clearing them out when looking at another method.