
Tech Tip: Using Command Catching to Trace large Portions of Code
PRODUCT: 4D | VERSION: 17 | PLATFORM: Mac & Win
Published On: October 10, 2019
When a code execution travels through mutliple processes and large portions of code, it may more beneficial to trace the code with a command catch rather than placing breakpoints at arbitrary locations. This is especially usefull when unexpected behaviors occur upon executing an application. For instance, if an object becomes empty during the execution, it may be due to a re-assignment of the object. You can set to catch all calls to New Object. This will open the debugger and display all instances of where calls to this command were made during the execution.
The Command Catch page is shown below:
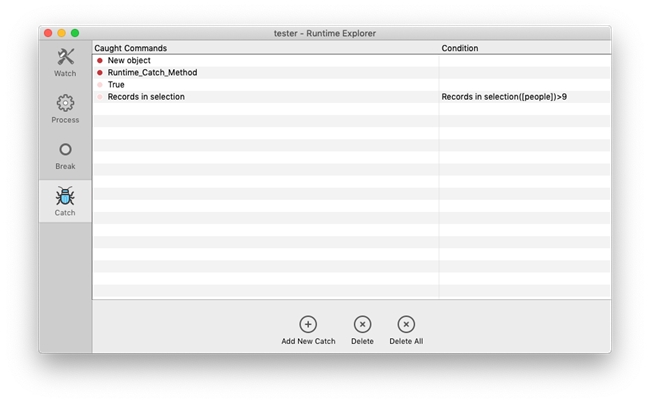
This page can be accessed through the top menu bar (Run > Runtime Explorer... > Catch tab of the Runtime Explorer)
Caught Commands:
The left column of the Command Catch window determines which commands will trigger the debugger during code execution. This encompasses command and project method calls.
Condition:
The right column is optional. This sets the condition for its corresponding command on the left. In the example image, the call on Records in selection will only trigger the debugger if there are more than 9 records in the selecion.
Enable/Disable:
The catch commands can be enabled or disabled by clicking on the dot before the command name. A red dot signifies that it's active and a faded dot means it's deactivated. Only active catch commands will trigger the debugger.
The Command Catch page is shown below:
This page can be accessed through the top menu bar (Run > Runtime Explorer... > Catch tab of the Runtime Explorer)
Caught Commands:
The left column of the Command Catch window determines which commands will trigger the debugger during code execution. This encompasses command and project method calls.
Condition:
The right column is optional. This sets the condition for its corresponding command on the left. In the example image, the call on Records in selection will only trigger the debugger if there are more than 9 records in the selecion.
Enable/Disable:
The catch commands can be enabled or disabled by clicking on the dot before the command name. A red dot signifies that it's active and a faded dot means it's deactivated. Only active catch commands will trigger the debugger.