
Tech Tip: Viewing Values of Object in the Debugger Source Code Pane
PRODUCT: 4D | VERSION: 19 | PLATFORM: Mac & Win
Published On: November 7, 2022
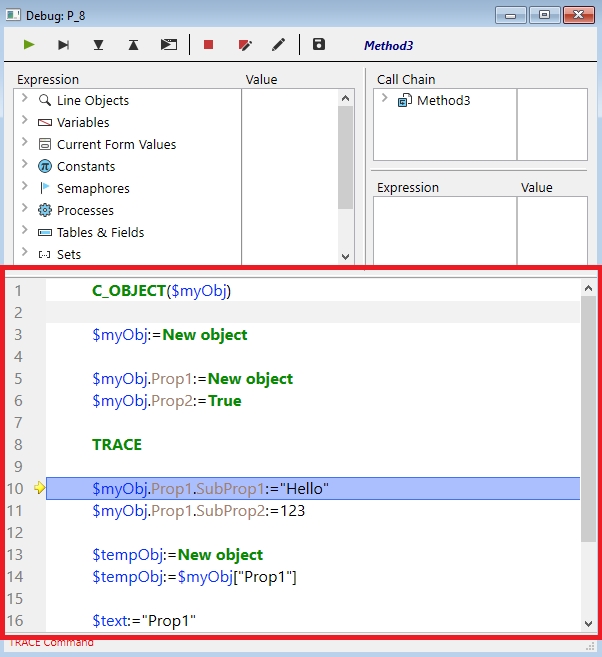
Using the 4D debugger can be helpful to investigate code to make sure it is running properly and identify issues. The debugger contains a source code pane that displays the code of the currently executed item, boxed in red in the following image:
A feature of the source code pane is the ability to view the values of variables at the current execution point by hovering the mouse cursor over a variable. Doing so will display a tool tip which shows details in the following format:
(expression) : (type) = (value)
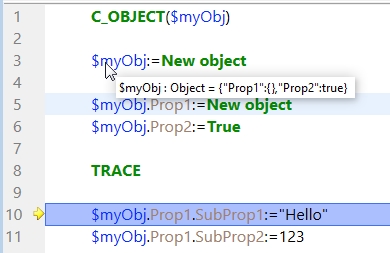
As shown in the image above
the expression is $myObj
the type is Object
and at the current execution point of Line 10, the value is {"Prop1":{},"Prop2":true}
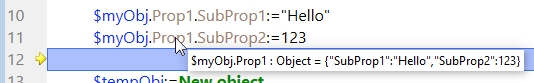
A additional feature when using dot notation, is that the value of the hovered property can be seen without showing the entire object.
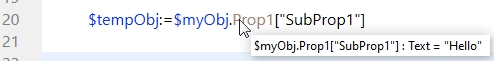
Hovering over Prop1:
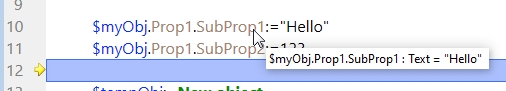
Hovering over SubProp1:
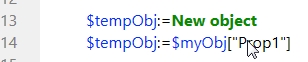
When using bracket notation there are some differences.
Hovering the property represented in the bracket as text will not show a tool tip:
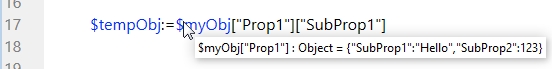
The first object using bracket notation is evaluated with the first bracket as a whole when hovering:

As mentioned, only the first bracket is evaluated, anything after the first bracket will not be evaluated:
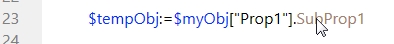
Using a mix of notations will allow properties and objects denoted by dots to as it did before while following the behaviors of both notations.
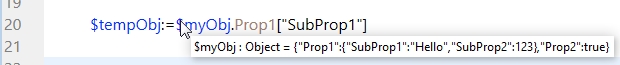
As mentioned, anything after the first braket will not be evaluated:
While there are some nuances to using the tool tips in the source code pane, it can be useful to quickly view the values of variables without needing the output the values to some other source like the expression pane.
A feature of the source code pane is the ability to view the values of variables at the current execution point by hovering the mouse cursor over a variable. Doing so will display a tool tip which shows details in the following format:
(expression) : (type) = (value)
As shown in the image above
the expression is $myObj
the type is Object
and at the current execution point of Line 10, the value is {"Prop1":{},"Prop2":true}
A additional feature when using dot notation, is that the value of the hovered property can be seen without showing the entire object.
Hovering over Prop1:
Hovering over SubProp1:
When using bracket notation there are some differences.
Hovering the property represented in the bracket as text will not show a tool tip:
The first object using bracket notation is evaluated with the first bracket as a whole when hovering:
As mentioned, only the first bracket is evaluated, anything after the first bracket will not be evaluated:
Using a mix of notations will allow properties and objects denoted by dots to as it did before while following the behaviors of both notations.
As mentioned, anything after the first braket will not be evaluated:
While there are some nuances to using the tool tips in the source code pane, it can be useful to quickly view the values of variables without needing the output the values to some other source like the expression pane.