
Tech Tip: Spotting memory leaks with info reports component
PRODUCT: 4D | VERSION: 19 | PLATFORM: Mac & Win
Published On: December 5, 2022
When an app begins to feel sluggish or stalls, it is best to rule out possibilities of a memory leak. The first step will be to install the Info Reports component here and let it log for a long enough time for the issue to occur. When a sufficient amount of logs is collected, it can be graphed using the component's aa4D_NP_Report_Compare_Display method.
For example, the graph below shows a steady memory usage increase despite having static users, tasks, and processes. Note that the black line denotes Used Ram
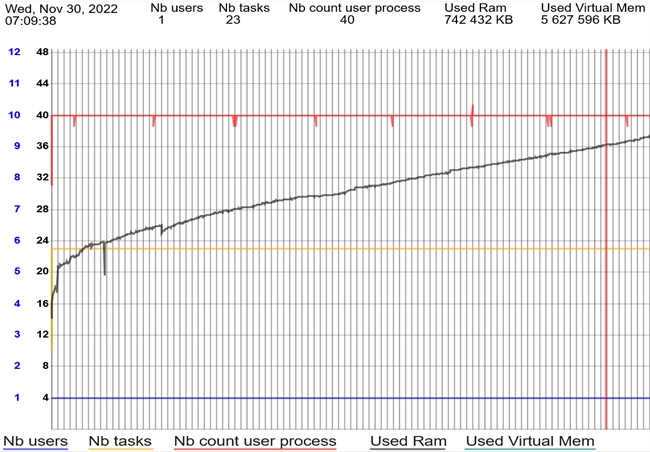
Once the memory leak has been confirmed, it is best to trace back to any methods/stored procedures called around the time of memory increase and make sure any possible lists or objects have been cleared using CLEAR VARIABLE.
For example, the graph below shows a steady memory usage increase despite having static users, tasks, and processes. Note that the black line denotes Used Ram
Once the memory leak has been confirmed, it is best to trace back to any methods/stored procedures called around the time of memory increase and make sure any possible lists or objects have been cleared using CLEAR VARIABLE.