
Tech Tip: How to use the Procdump Tool Interface (2023)
PRODUCT: 4D | VERSION: 19 | PLATFORM: Win
Published On: March 13, 2023
The Procdump tool for 4D monitors any running instances of 4D and generates a dump file when the application crashes. This can provide insight to the QA team about why a certain crash occurs and help the engineers work faster towards a solution. Please note that this tool is only available for Windows and 4D v11 and newer.
Step-by-step instructions:
Aside: Generate dump now vs. monitoring
There are two ways to generate a dump: manually through immediate dump generation or automatically when 4D crashes or hangs. An immediate dump file generation will create a snapshot of the memory at the moment this option is clicked, so it will not provide much information about a crash.
To monitor one instance of 4D:
Under the “One dump” tab, select whether ProcDump should monitor for a crash or a hang (or both) then click "Launch". A command prompt window should appear and show that ProcDump is monitoring 4D until the application crashes. At that point, a dump file will be generated at the location specified in the "Output path" section of the interface.
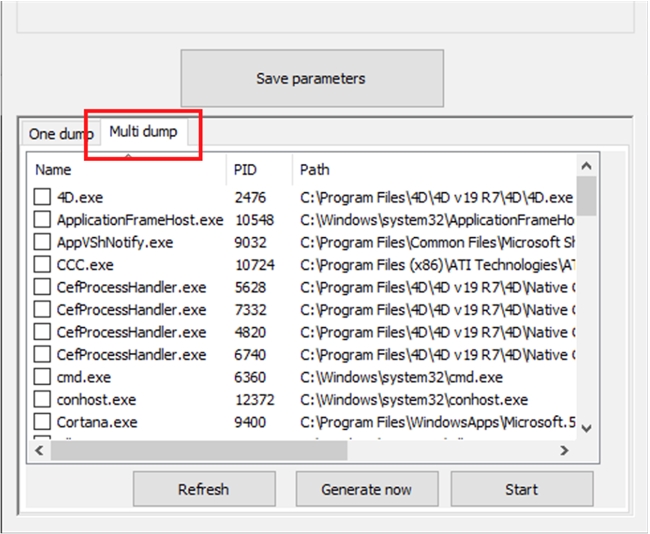
To monitor multiple instances of 4D:
If you click on the "Multi dump" tab in the bottom half of the window, you can select multiple instances of 4D to monitor (you may need to refresh the selections before doing so). Then, click on "Start" to initiate monitoring. Multiple command prompt windows should appear.
Note: you will need to relaunch the tool every time a crash happens; it will not relaunch automatically.
Step-by-step instructions:
- Download and install the ProcDump tool from the TAOW website. On the left-hand side, click on the second tab (it includes an icon of a piece of paper with three lines and a hand). Select the ProcDump Interface tool that matches the version of 4D you are using.
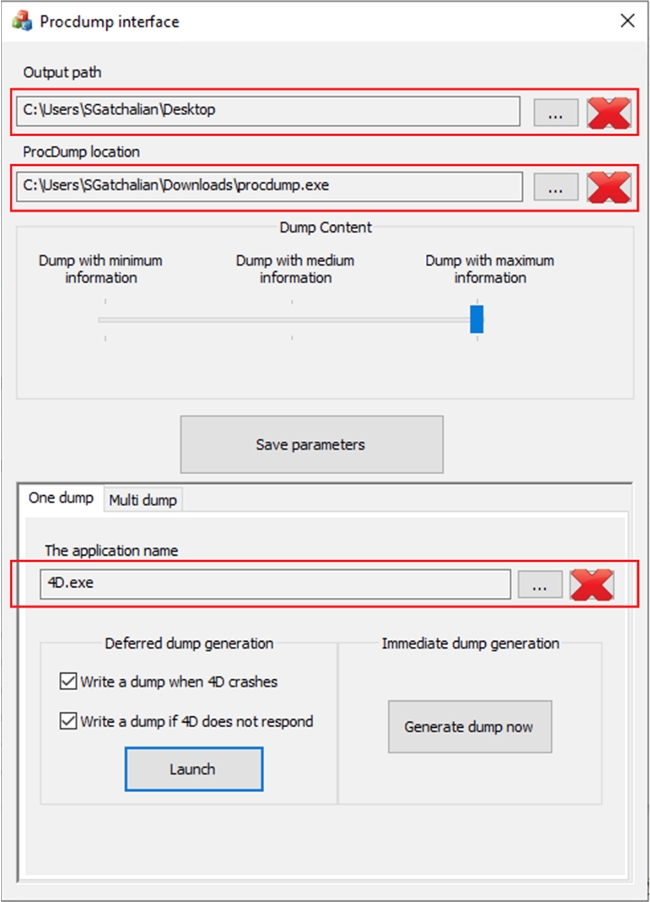
- Extract the files from the compressed .rar file. Open the "procdumpInterface.exe" application. You will need to set the paths for three things:
- the destination where the dump file will be saved
- the location of the "procdump.exe" application
- the application that the ProcDump tool will monitor (in this case, it will be 4D).
Set those paths according to the location of each item (refer to the screenshot below). - Under "Dump Content", leave the configuration as "Dump with maximum information". The more information about a crash there is, the more data the QA team has to work with to provide a fix. If your machine cannot handle generating a dump file at this level, select one of the lower options.
Aside: Generate dump now vs. monitoring
There are two ways to generate a dump: manually through immediate dump generation or automatically when 4D crashes or hangs. An immediate dump file generation will create a snapshot of the memory at the moment this option is clicked, so it will not provide much information about a crash.
To monitor one instance of 4D:
Under the “One dump” tab, select whether ProcDump should monitor for a crash or a hang (or both) then click "Launch". A command prompt window should appear and show that ProcDump is monitoring 4D until the application crashes. At that point, a dump file will be generated at the location specified in the "Output path" section of the interface.
To monitor multiple instances of 4D:
If you click on the "Multi dump" tab in the bottom half of the window, you can select multiple instances of 4D to monitor (you may need to refresh the selections before doing so). Then, click on "Start" to initiate monitoring. Multiple command prompt windows should appear.
Note: you will need to relaunch the tool every time a crash happens; it will not relaunch automatically.