
Tech Tip: Analyzing reports from the Info Reports Component
PRODUCT: 4D | VERSION: 20 | PLATFORM: Mac & Win
Published On: January 2, 2024
The Info Reports Component is a powerful tool to use in gathering statistics on a running 4D database and its environment, which can help in diagnosing certain technical issues such as memory leaks. The download link and instructions to install and set up this component can be found on the old TAOW website: https://taow.4d.com/Tool-4D-Info-Report/PS.1938271.en.html.
Once you have gathered enough reports or were able to log reports surrounding the time when an issue occurs, you can generate visual graphs using the component itself. You can use the following instructions to do so:
Once you have gathered enough reports or were able to log reports surrounding the time when an issue occurs, you can generate visual graphs using the component itself. You can use the following instructions to do so:
- Run 4D in single-user mode, and open the Info Reports Component.
- Go to File > Local reports compare. The dialogue window below should appear.
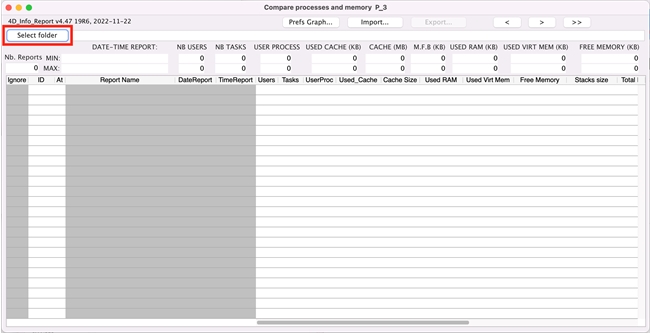
- Click on the Select folder button, as indicated in the picture above. Then, select the folder where the component saved the local reports; typically, the folder is named Folder_reports.
- Click on the Graph... button, and another window will pop up with the generated graph.

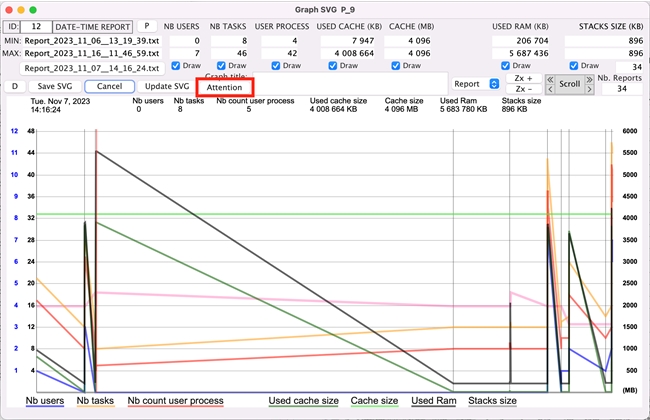
Within this window, you enable/disable the view of specific trend lines, select a specific date and time to investigate the data gathered at that specific point in time, and export your findings. If you click on the Attention button, the component can also point out anomalies at a certain point in time.