
Tech Tip: Debug javascript code in web area
PRODUCT: 4D | VERSION: 20 | PLATFORM: Mac & Win
Published On: June 10, 2024
When developing a web page for a web area, if a significant amount of javascript code is used, the code may need to be debugged at some point. A useful tool for doing this is the web console. To access it from the web area, first enable the web inspector by executing the following on the web area object:
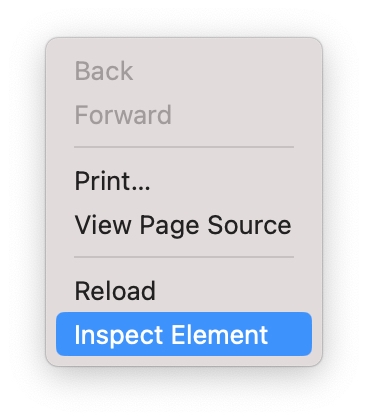
Then, when the page is loaded in the web area, open the context menu and select "Inspect Element".
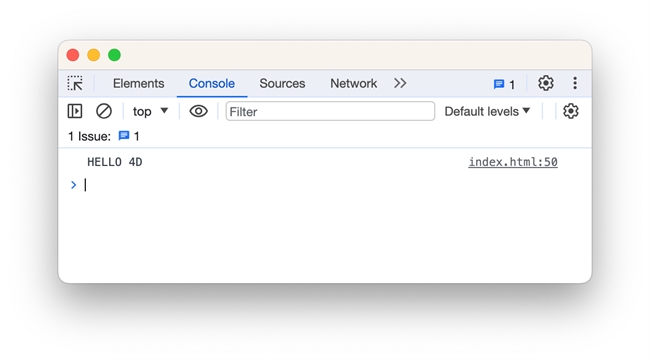
This will launch the web inspector (either in the same window or another window depending on the web rendering engine used) for the page, with various tabs: "Elements", "Console", "Sources", etc. Select the "Console" tab to view the web console, where values of javascript variables can be logged for debugging purposes. For example, given the following javascript code:
The value of variable 'myStr' can be inspected in the web console.
| WA SET PREFERENCE(*; "Web Area"; WA enable Web inspector; True) |
Then, when the page is loaded in the web area, open the context menu and select "Inspect Element".
This will launch the web inspector (either in the same window or another window depending on the web rendering engine used) for the page, with various tabs: "Elements", "Console", "Sources", etc. Select the "Console" tab to view the web console, where values of javascript variables can be logged for debugging purposes. For example, given the following javascript code:
| var myStr = "HELLO " + "4D"; console.log(myStr); |
The value of variable 'myStr' can be inspected in the web console.