
Tech Tip: Manually Capturing a Freeze Report on macOS
PRODUCT: 4D | VERSION: 20 | PLATFORM: Mac
Published On: August 18, 2025
When 4D or 4D Server becomes unresponsive (i.e., freezes or hangs) on macOS, capturing a diagnostic report can help identify the cause, such as stuck threads, resource issues, or code bottlenecks. This is often referred to as a "sample process" or "spindump" report. Unlike crash reports, which are generated automatically on termination, freeze reports must be captured manually while the application is still frozen.
Using Activity Monitor
Using Spindump in Terminal For System-Wide Hangs/Freezes
Using Activity Monitor
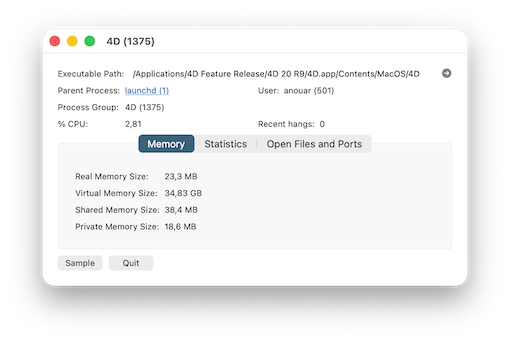
- Open Activity Monitor .
- In the CPU tab, search for "4D" or "4D Server" and select the unresponsive process (may show as "Not Responding").
- Click the gear icon (or "i" icon in newer macOS) in the toolbar and select Sample . Enter admin password if prompted.
- Let it sample for ~10 seconds; a report window will appear.
- Save the report as a .txt file (e.g., "4D_Freeze_Report.txt").
Using Spindump in Terminal For System-Wide Hangs/Freezes
- Open Terminal .
- Find the Process ID (PID) by running: ps aux | grep "4D". Identify the PID for "4D" or "4D Server" (second column).
- Run: sudo spindump <PID> 10 -file ~/Desktop/4D_Freeze_Spindump.txt, replace <PID>with the actual number. Enter admin password when prompted.
- Wait ~10 seconds for spindump to complete. The report is saved to the Desktop as "4D_Freeze_Spindump.txt".