Tech Tip: Checking for Cache Thrashing on a 4D Server Using the 4D Info Report Component
PRODUCT: 4D | VERSION: 20 | PLATFORM: Mac
Published On: October 7, 2024
Cache thrashing is an issue that is characterized by high CPU usage and slow application level processing. Cache thrashing occurs when there is an excessive use of resources or conflicts in the caching system. This can cause the undesirable eviction of useful data and prevents client processes from taking advantage of the caching system.
If a 4D Server is experiencing performance issues, this is how a developer can check for cache thrashing:
1. Download the 4D Info Report Component off of Github. Setup instructions can also be found at this knowledge base post.
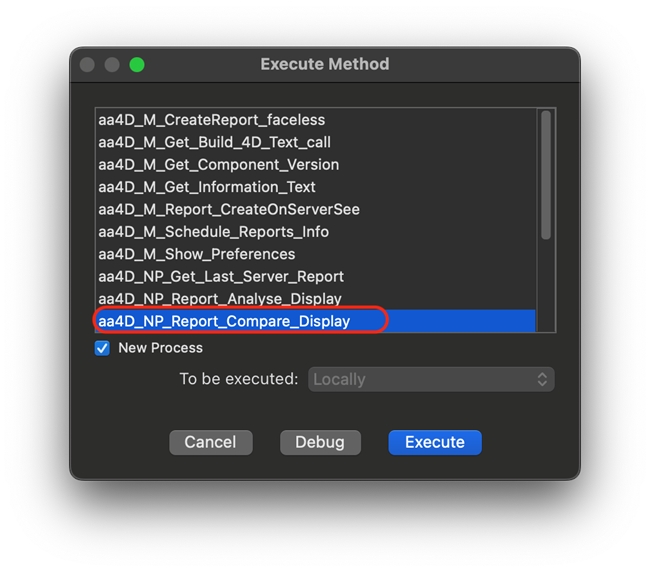
2. Once the Logs have been running long enough for the performance issues to be felt execute "aa4D_NP_Report_Compare_Display"

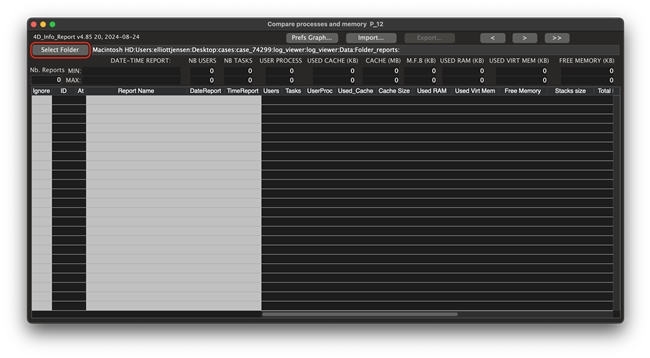
4. Then select "Select Folder" in the upper left corner and select the folder that contains the logs

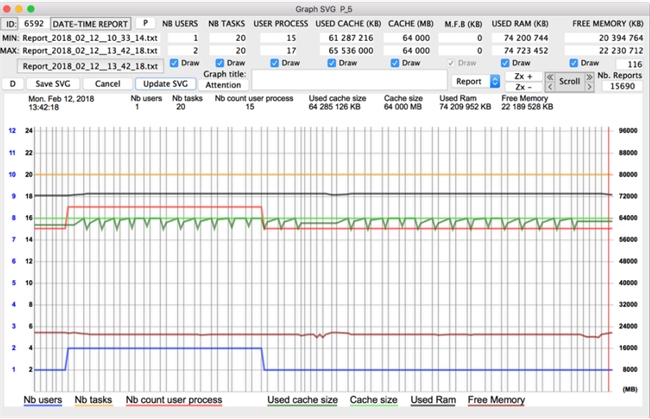
5. If the graph looks like the following image where the used cache size is constantly hitting the cache size then the machine is likely experiencing cache thrashing.

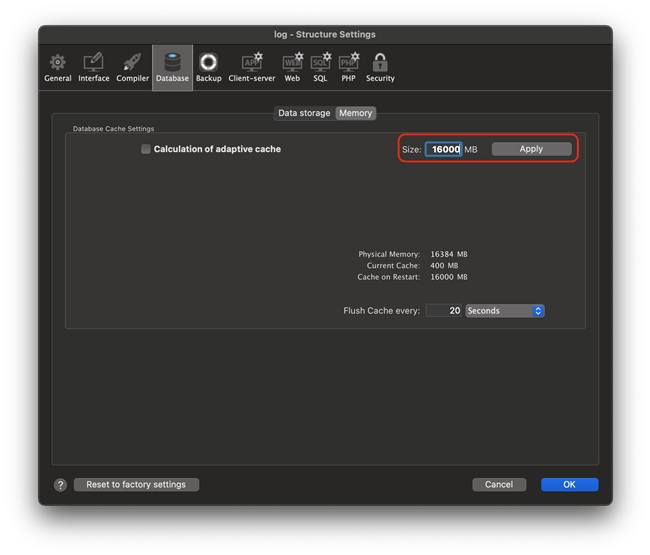
Cache thrashing can often be fixed by increasing the size of the cache. On a machine that is dedicated to only running a 4D Server the upper limit for the cache size should be 50% of available RAM (there are exceptions to this this, but exceeding 50% should be done cautiously and not without monitoring). If it is not possible to increase the cache without exceeding this 50% limit then running the server on a machine with more available RAM may be necessary. After increasing the cache size developers should continue to monitor the server using the 4D Info Component to see if further adjustments are required.

